
Every founder who signs off on a GEO budget eventually gets the same question from a CFO, a board member, or their own gut: "What are we actually getting for this?"
It's a fair question. Generative Engine Optimization is still new enough that most finance teams don't have a template for it. Traditional SEO ROI models lean on rankings, sessions, and last-click attribution. None of that maps cleanly onto a world where the "result" is your brand being quoted inside a ChatGPT answer that a prospect never clicks through from.
At Lureon, this is the question we get asked in nearly every onboarding call. This article lays out the framework we actually use: what to measure, how to price it, and how to turn it into a number a CFO can put in a spreadsheet.
The stakes of getting this wrong run in both directions. Undervalue GEO and it gets cut in the first budget review, right as it starts compounding. Overvalue it with vague "visibility" metrics and you lose credibility the first time a CFO asks how a citation turns into cash. Neither outcome serves the business. What follows is written for the founder who has to defend the line item, and the CFO who has to approve it. The goal is a model both sides can agree on before the first invoice arrives.
Key Takeaways
- GEO ROI can't be modeled the same way as SEO ROI, because the primary output, an AI citation, often produces zero click and zero session data.
- A defensible GEO ROI framework needs three inputs: fully-loaded cost, a value assigned to each conversion pathway, and a realistic lag period before results compound.
- The most useful metric isn't "visibility." It's assisted pipeline: deals where AI-search touched the buyer journey before a human sales conversation started.
- Founders should report GEO in the same cadence and format as paid acquisition channels, not as a separate "content" line item.
- Expect a 60–120 day lag between content going live and citations compounding into measurable traffic or leads. Build that into any ROI timeline you present internally.
Why Standard ROI Models Break for GEO
Traditional marketing ROI is built on a simple chain: spend produces traffic, traffic produces conversions, conversions produce revenue. Every link in that chain is trackable in Google Analytics or a CRM.
GEO breaks the first link. When ChatGPT, Perplexity, Claude, or Google's AI Overviews cite your brand in an answer, the user often gets what they need without ever visiting your site. This isn't a hunch: Pew Research Center tracked real browsing behavior and found that Google searches producing an AI-generated summary result in noticeably fewer clicks to source websites than searches without one.
The value was delivered in the answer itself, not on your landing page, which means your analytics never see it.
This is why founders who try to justify GEO spend using pageviews or organic sessions alone usually end up underselling the investment, or worse, killing a channel that's quietly working in the background of every AI-assisted buying decision.
A workable ROI framework has to account for value that happens off-site, before a prospect ever becomes a trackable lead.
The Core GEO ROI Formula
Start with the same skeleton you'd use for any channel, then adjust the inputs for how GEO actually produces value:
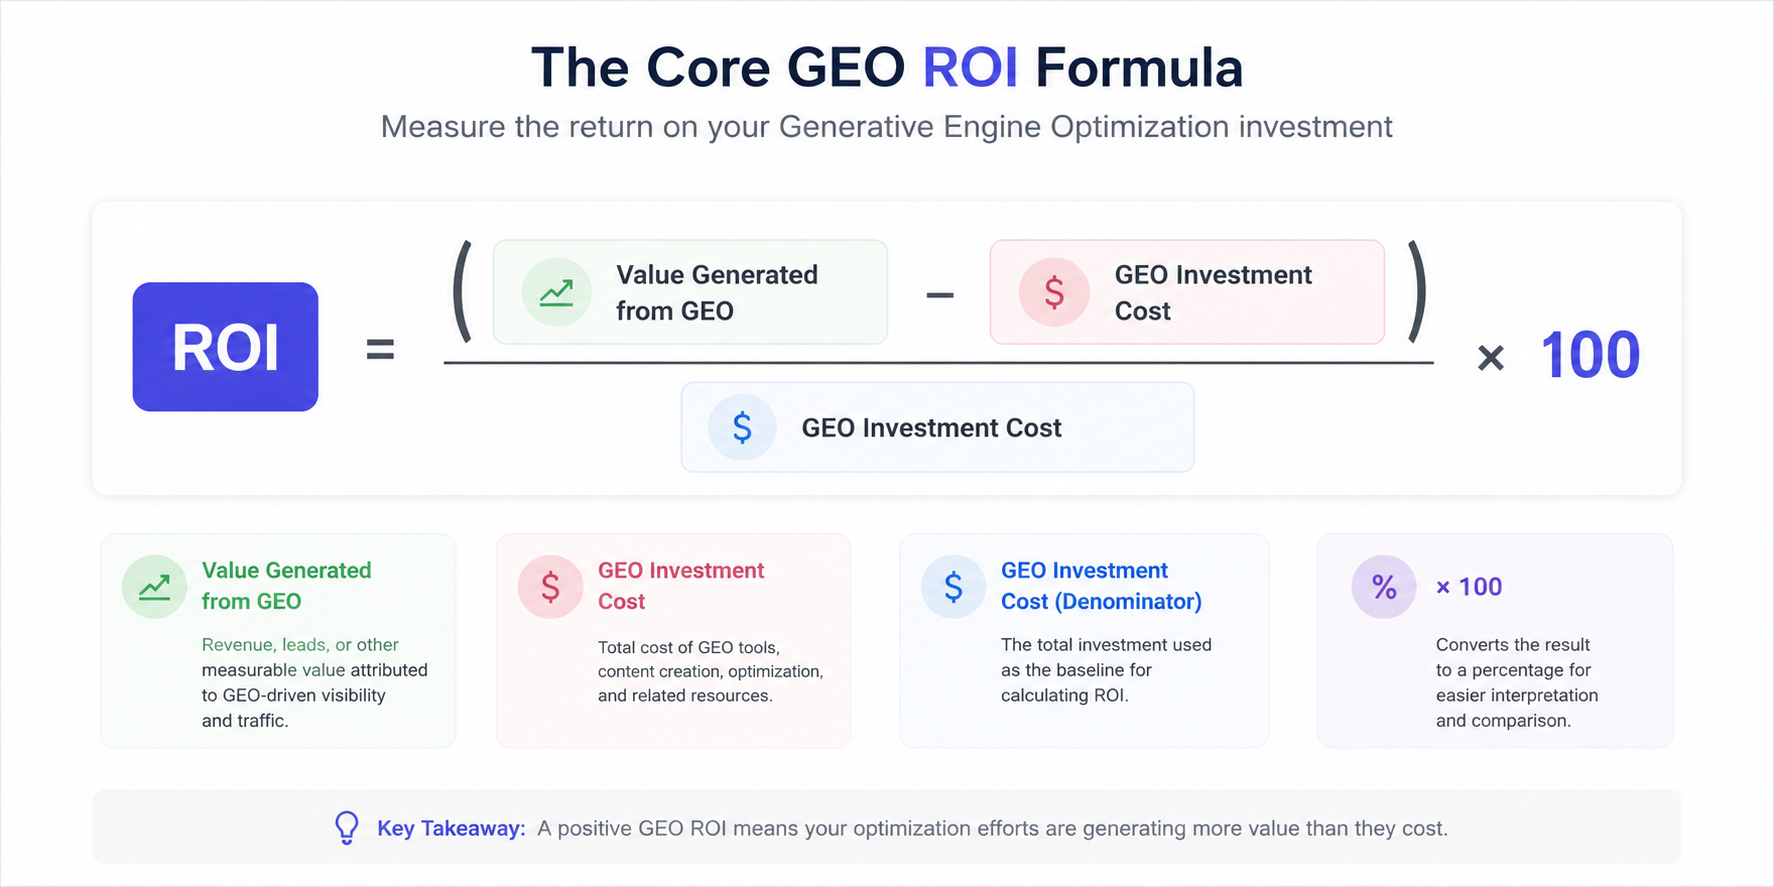
The formula is simple. The work is in defining the two inputs correctly, since both behave differently than they do for paid or traditional SEO channels.
1. Fully-Loaded GEO Cost
Include everything, not just the retainer or agency fee:
- Agency or freelancer spend on strategy, writing, and technical implementation
- Internal hours from marketing, product, or subject-matter experts reviewing and approving content
- Tooling costs for citation tracking and AI-visibility monitoring
- Any paid distribution or backlink spend tied to the GEO program
Founders frequently under-count internal review time. If your head of product spends three hours a month fact-checking technical articles, that's a real cost against the channel.
2. Value of Attributed Outcomes
This is where most ROI models for GEO fall apart, because "attribution" doesn't mean the same thing here as it does for a Google Ads campaign. Instead of one clean attribution path, use three tiers, ranked by how directly they connect to revenue:
- Direct: Leads or signups that arrive via a link inside an AI answer (measurable through referral traffic from chat.openai.com, perplexity.ai, and similar sources in your analytics).
- Assisted: Deals where a prospect mentions in a sales call or intake form that they "found you through ChatGPT" or "saw you recommended," as captured through a source-of-discovery question in your sales process.
- Positional: Improved close rates on deals sourced elsewhere, because the prospect had already seen your brand cited as an authority before the sales conversation started. This one is the hardest to quantify and is best estimated conservatively, using win-rate deltas between prospects who mention prior AI exposure and those who don't.
A Worked Example
Here's a simplified version of how this looks in practice for a B2B SaaS company spending $2,000/month on GEO, six months into the program.
- Fully-loaded 6-month cost: $12,000 (retainer) + $1,800 (internal review time) + $600 (citation tracking tool) = $14,400
- Direct conversions: 14 leads attributed to AI-referral traffic, 3 closed at an average contract value of $9,000 = $27,000
- Assisted deals: 5 deals where the buyer cited AI search as a discovery source during intake, 2 closed at $9,000 average = $18,000, discounted 50% to account for shared attribution with other channels = $9,000
- Positional lift: Estimated conservatively at 10% of remaining pipeline closed in the period ($40,000) = $4,000
Total attributed value: $27,000 + $9,000 + $4,000 = $40,000
ROI: ($40,000 − $14,400) / $14,400 × 100 = 178%
Whether your own numbers look like this depends entirely on deal size and sales cycle length. A company with a $500 average contract value needs a very different volume of citations to hit the same ROI as one closing $50,000 enterprise deals. Run the formula with your own numbers before presenting it internally.
Sensitivity Analysis: How Deal Size Changes the Math
The formula doesn't change based on business model, but the inputs that drive it do. It's worth running the numbers at both ends of the spectrum before you commit to a reporting structure, since a model built for one motion can badly mislead the other.
High-ticket B2B
Long sales cycles mean the direct tier stays thin for months, sometimes producing only a handful of trackable leads even with strong citation growth. Most of the return shows up in the assisted and positional tiers instead, because a single closed enterprise deal that mentioned "we saw you cited by ChatGPT" during discovery can single-handedly swing the ROI calculation. This makes discovery-source tagging in the sales process non-negotiable: without it, a high-ticket business has almost no way to see GEO's contribution at all.
Low-ticket e-commerce and PLG
Here the direct tier does most of the work. Volume is high enough that referral traffic from AI platforms becomes statistically meaningful within weeks, and conversion rate on that traffic can be benchmarked directly against organic and paid channels. Positional lift matters less, since there's rarely a human sales conversation for it to influence. The tradeoff is that average order values are small enough that it takes considerably more citation volume to produce the same absolute ROI as a single enterprise deal.
Mid-market and usage-based pricing
This segment sits in between and is often the hardest to model cleanly, because expansion revenue from an existing account muddies the attribution picture. If a self-serve customer who first found you through an AI answer later expands into a much larger contract, decide up front whether that expansion value counts toward GEO's ROI or gets attributed to customer success. Whichever you choose, apply it consistently so quarter-over-quarter comparisons stay honest.
Metrics to Track Before You Can Calculate Any of This
The formula above only works if the underlying data exists. Set these up before you try to report ROI, ideally in the same dashboard you already use for other channels:
- Citation frequency: How often your brand appears in AI-generated answers for target queries, tracked across ChatGPT, Perplexity, Claude, and Google AI Overviews.
- Share of voice: Your citation rate relative to named competitors on the same set of prompts.
- AI-referral traffic: Sessions with a referrer from an AI platform, segmented separately from organic search in analytics.
- Discovery-source tagging: A mandatory field in your intake form or first sales call asking how the prospect found you, with "AI search / ChatGPT / Perplexity" as an explicit option rather than lumping it into "other."
- Time-to-citation: How long after publishing a new piece of content it starts appearing in AI answers, which tells you how much lag to build into forward projections.

Setting a baseline before you start
Run a citation audit against your target query set before any new content goes live, not after. Without a "before" snapshot, it's impossible to credit growth in citation frequency or share of voice to the GEO program specifically, as opposed to normal fluctuation in how the underlying models behave. This baseline audit is also the fastest way to identify which competitors already dominate the answers you're trying to win, which shapes how aggressive the ROI targets in your first two quarters should realistically be.
Most teams underestimate how much of this tracking has to be built rather than bought off the shelf. Referral segmentation for AI platforms usually requires custom filters in your analytics setup, and discovery-source tagging has to be added to your CRM or intake form manually. Budget the time to set this up in month one; a program that starts tracking in month four has already lost a full quarter of comparable data.
Common Pitfalls When Calculating GEO ROI
Measuring too early
AI models don't index and start citing new content instantly. Expect a lag of roughly 60–120 days between publishing and citations compounding into visible traffic. Running an ROI calculation at 30 days will almost always understate the channel.
Ignoring positional value entirely
Because positional lift is hard to measure precisely, some finance teams drop it from the model altogether. That understates GEO's real contribution. A better approach is including it at a conservative, clearly-labeled estimate rather than excluding it.
Double-counting with SEO
Good GEO content often improves traditional search rankings too, since both reward clarity, structure, and topical depth. This overlap isn't just a reporting inconvenience: Google Search Central now states plainly that its generative AI search features run on the same core ranking and quality systems as classic Search, rather than a separate model. Decide up front how you'll split credit between the two channels so you're not claiming the same revenue twice in two different reports.
Comparing GEO ROI to paid media ROI on the same timeline
Paid campaigns can be measured weekly. GEO compounds over months as citation authority builds. Report it on a quarterly cadence, not a weekly one, or the early numbers will look artificially weak next to channels built for short feedback loops.
How to Present This to a CFO
CFOs don't need to be convinced that AI search matters; most already know that. What they need is a number that behaves like every other line item in the budget: a cost, a return, and a payback period.
Frame the report around three numbers:
- Cost per citation: fully-loaded spend divided by the number of queries where your brand now appears, which shows efficiency trending over time.
- Blended ROI: the formula above, recalculated quarterly as more data accumulates and the lag period resolves.
- Payback period: how many months until attributed value (direct plus assisted) exceeds cumulative spend.
This is the same reporting shape used to justify spend on paid search or outbound sales development, which makes it far easier for a finance team to evaluate GEO on its own terms instead of dismissing it as unmeasurable.
A Quarterly GEO Board Report, Section by Section
Founders who report GEO well tend to use the same four-part structure every quarter, so stakeholders can track trends without relearning the format each time:
- Visibility snapshot: Citation frequency and share of voice against named competitors, shown as a trend line rather than a single point-in-time number.
- Pipeline contribution: Direct, assisted, and positional value for the quarter, broken out separately rather than blended, so finance can see which tier is driving growth.
- Efficiency: Cost per citation and blended ROI, compared against the prior quarter to show trajectory, not just a snapshot.
- Forward look: Content currently in the pipeline and its expected time-to-citation, so the next quarter's numbers don't arrive as a surprise in either direction.
Keeping the structure identical every quarter is what actually builds trust with a board or a CFO. A model that changes its own definitions every few months is much harder to approve a budget against, even if the underlying results are strong.
Conclusion
GEO ROI is measurable. It just isn't measurable the same way paid media or last-click SEO is, and treating it that way is what makes founders either overspend without accountability or underinvest in a channel that's already influencing how their buyers make decisions.
Build the tracking first, price all three tiers of attributed value honestly, and give the channel the 60–120 day runway it needs before judging results. That's the difference between a GEO line item that survives budget season and one that gets cut before it has a chance to compound.
None of this requires guesswork or industry-wide averages that may not fit your business. It requires a baseline, a consistent set of definitions, and the discipline to report on the same schedule every quarter. That's the same discipline finance already applies to every other channel in the budget. Get that in place early, and the ROI conversation stops being a defense and starts being a dashboard.
If you'd rather have this framework set up and reported for you every month.
FAQs
1. How long before GEO shows a positive ROI?
Most programs need 60–120 days before citations compound into measurable traffic or leads, and 2–3 full quarters before ROI numbers stabilize enough to trust. Measuring earlier than that typically understates the channel.
2. What's the single most important metric for GEO ROI?
Discovery-source tagging in your sales process. Without a mandatory "how did you find us" field that explicitly includes AI search platforms, assisted and positional value are invisible no matter how good your citation tracking is.
3. Should GEO and SEO ROI be reported separately?
Where possible, yes, since they're increasingly overlapping. Decide upfront how credit is split for content that drives both traditional rankings and AI citations, so the same revenue isn't counted twice in two different reports.
4. How do you estimate positional value if it's not directly trackable?
Use a conservative percentage of pipeline closed in the period, informed by win-rate differences between prospects who mention prior AI exposure and those who don't. Label it clearly as an estimate rather than a hard number in any report to finance.
5. Does GEO ROI look different for high-ticket B2B versus low-ticket e-commerce?
Significantly. High-ticket B2B sees ROI concentrated in a small number of assisted and positional deals, while e-commerce sees it spread across a larger volume of smaller direct conversions. The formula stays the same; only the weighting of the three value tiers changes.